Greece General Shares Index (weekly),20 week exponential average ingreen, 5 week exponential average inred, 5MACD (moving average convergence divergence) in green.
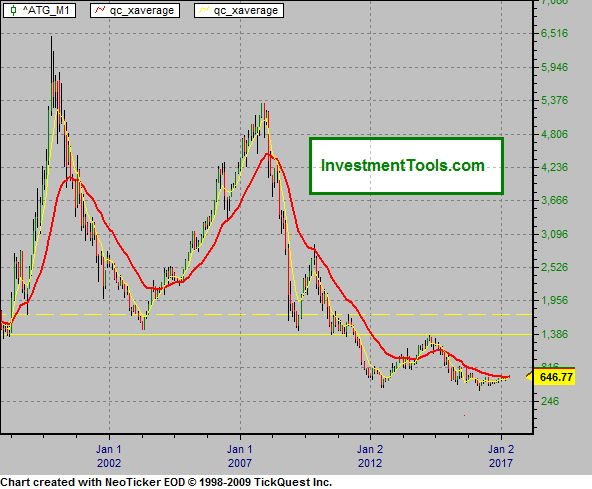
Greece General Shares Index monthly chart, the red line is a 24 month exaverage, the yellow line is a 6 month exaverage.
This chart is no longer updated but will remain for reference.
Greece Notes & Links:
5/4/14 Greece sells five-year bonds at 4.5% rate
7/20/13 German austerity chief, finance Minister Wolfgang Schauble has warned Greek leaders not to play with fire by pressing for fresh debt-relief. He urged Greeks not to back track from their painful austerity and reform path. Whats the problem? You Greeks dont like 28.2% unemployment - too high?
7/6/13 The IMF is preparing to suspend aid payments to Greece by the end of next month unless Eurozone leaders plug a 3bn-4bn shortfall that has opened up in Greeces 172bn rescue program.
8/3/12 Greece is fast running out of cash while it waits for its next installment of aid from international lenders.
7/13/12 Greek unemployment rose to a new record of 22.5% in April
6/3/12 Southern Europe's debtor states must pledge their gold reserves and national treasure as collateral under a 2.3 trillion stabilization plan gaining momentum in Germany.
Chinese ratings provider Dagong Global Credit Rating Co. said Friday that it upgraded the local and foreign currency sovereign credit rating of Greece from D to CC with a negative outlook.
2/10/12 The Hellenic Statistical Authority said YoY Greeces manufacturing output contracted by 15.5% in December and industrial output fell 11.3%, having fallen 7.8% in November. Unemployment jumped to 20.9% in November, up from 18.2% in October - a rise of 14% in a month.
2/9/12 Greek jobless rate hits new record high at 20.9%
11/18/11 The new Greek coalition government submitted the 2012 draft budget, forecasting an ambitious budget deficit cut to 5.4 % of GDP next year from this year's 9.0 %
10/20/11 Greek politicians have passed a tough austerity package while the country has been paralyzed by a 48-hour general strike.
9/18/11 without fresh aid, Greece will run out of money by mid-October, the WSJ said.
6/21/11 (FT) Greek citizens are emptying savings accounts and buying gold.
6/18/11 A deal isn't yet in sight for the next Greek rescue package, but Nicolas Sarkozy and Angela Merkel sought to express unity during a Friday meeting at the Chancellery in Berlin. Both, however, now agree that bank participation should be voluntary.
6/18/11 Greece has been downgraded three notches to triple C by Standard & Poors, just two notches above default.
Greenspan (the ex chief default facilitator) said that a Greek default was likely.
11/1/2010 Moodys' said Greece, Portugal and Ireland are likely to avoid sovereign bond defaults due to strong domestic demand from local banks and pension funds
8/6/10 Greek CPI rose 5.5% YoY in July
7/12/10 Greece cuts deficit by 46% YoY -- beating target
6/14/10 (Bloomberg) -- Greeces credit rating was cut four steps to non-investment grade, or junk, by Moodys Investors Service, which cited the countrys economic risks. The rating was lowered to Ba1 from A3.
6/2/10 Greece announced long-delayed plans to privatize state-owned companies as part of its attempt to fix its public finances and chip away at the massive public debt.
4/27/10 Greeces credit rating was cut three steps to junk by Standard and Poor
3/1/10 (WSJ) The EU's monetary affairs commissioner said the EU is ready to support Greece, but urged the country to take further measures to shrink its budget deficit.
2/9/10 (Reuters) - European governments have agreed in principle to help heavily indebted Greece, a senior German coalition source said on Tuesday, in what would be the first rescue of a euro zone member in the currency's 11-year history.
Billionaire investor George Soros said he is confident Greece will do whatever is necessary to remain a member of the Euro.
2/2/10 Debt-hit Greece should not be bailed out, one of the founders of Europe's euro currency has warned.
12/17/09 Standard and Poor's cut Greece's credit rating from A- to BBB+.
12/9/09 Greece's new socialist government promised Wednesday to step up efforts to reduce the growing deficit after a ratings agency downgraded the country's debt rating.
1/14/09 Standard & Poor's has downgraded Greek sovereign debt in a move that will make it even harder for the country to finance its ballooning deficits