InvestmentTools.com | home 
About Equities Commodity/Futures The State Notes/Bonds Editorials Com$tock Letter Links The Fed & Short Sales Real Estate Miscellaneous
It is not the crook in modern business that we fear, but the honest man who does not know what he is doing.
Owen D. Young
|
DJUA Dow Jones Utilities Average
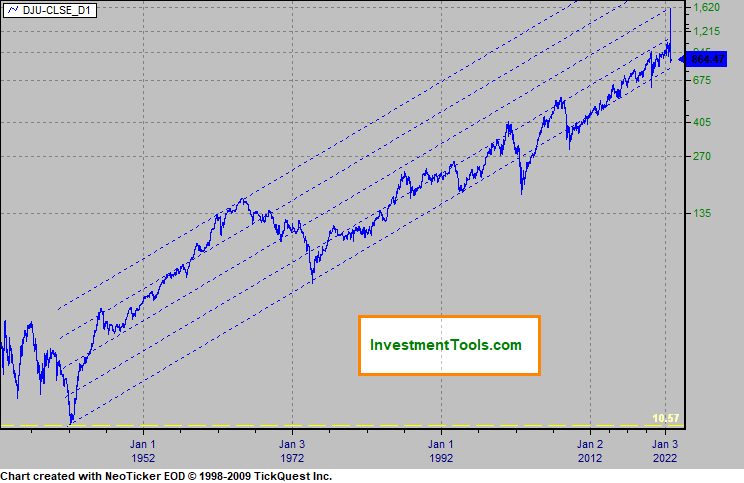
DJU from 1929 "Log" Chart
|
|

|
|
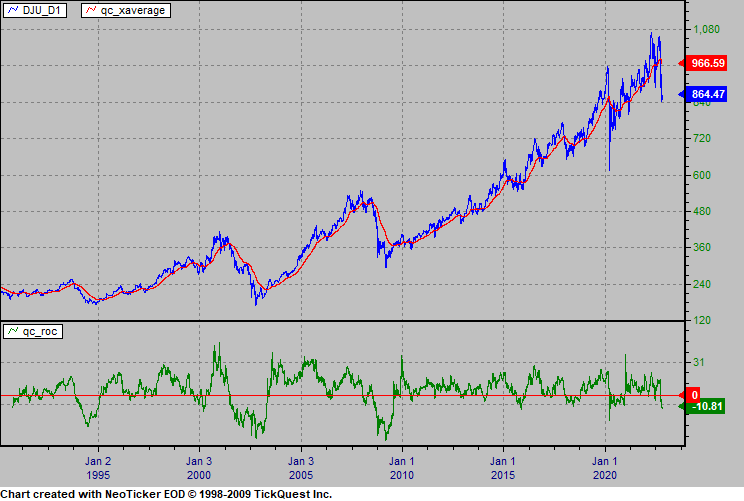
DJU and 200 day exponential average (red), 200 day rate of change (green)
|
|

|
|
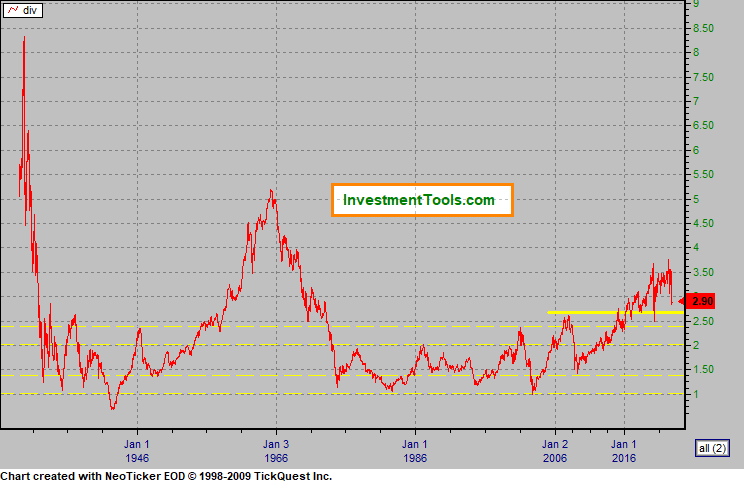
Dow Jones Utility adjusted by the CPI (Consumer Price Index)
|
|

|
|
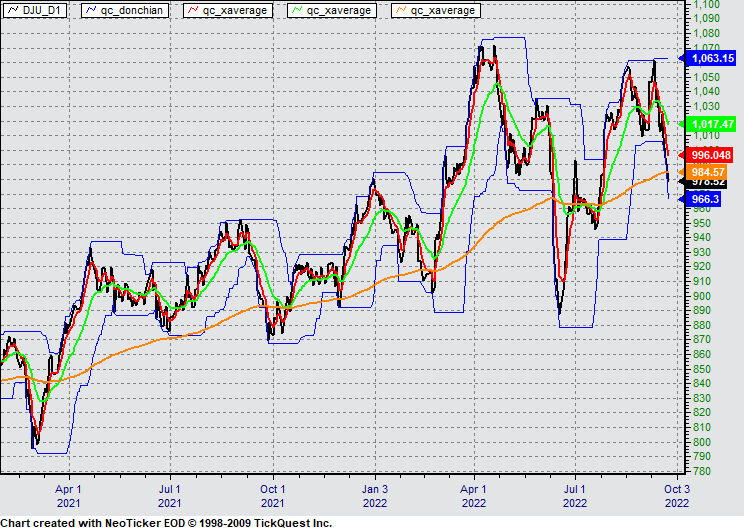
DJU Index (recent)The Blue line is a 20 day Donchian channel, red line is a 5 day exponential average, green line is a 20 day exponential average,200 day xaverage yellow.
|
|

|
|
Jones Utility Index Point & Figure (Spot)
Box value = 2 reversal = 3
|
|

|